Skip to content
1.0 The snapshot

See the whole business. Steer it with proof.

A current snapshot of how the business is performing — and what to expect if nothing changes. Owners open on Home; each department opens on its own Today. Performance across every department, goals that push themselves down as targets, and Cannvas AI reading it all — the brief first, the action on every line, the manual work done for you with your approval.

How it’s going — and where it lands if nothing changes.

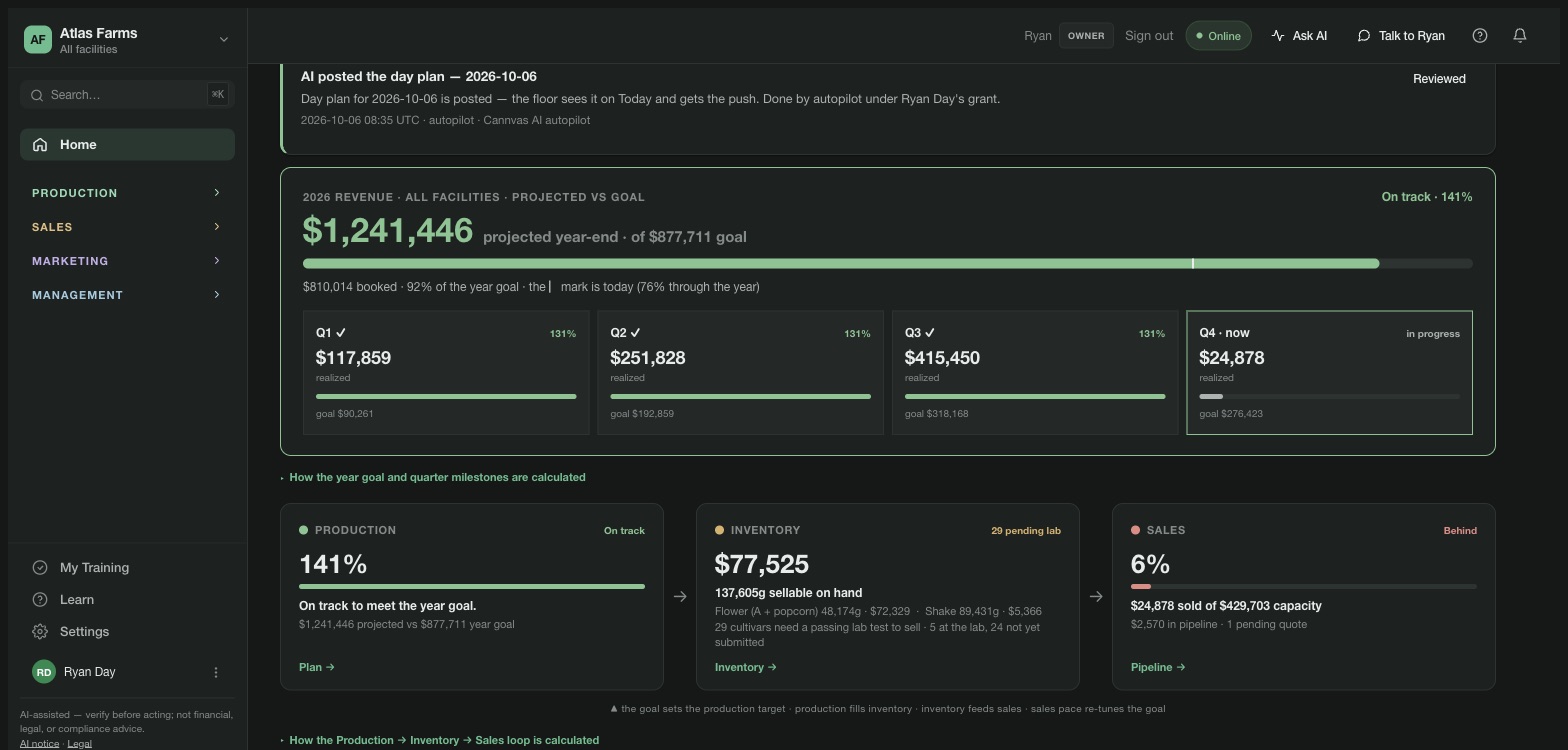
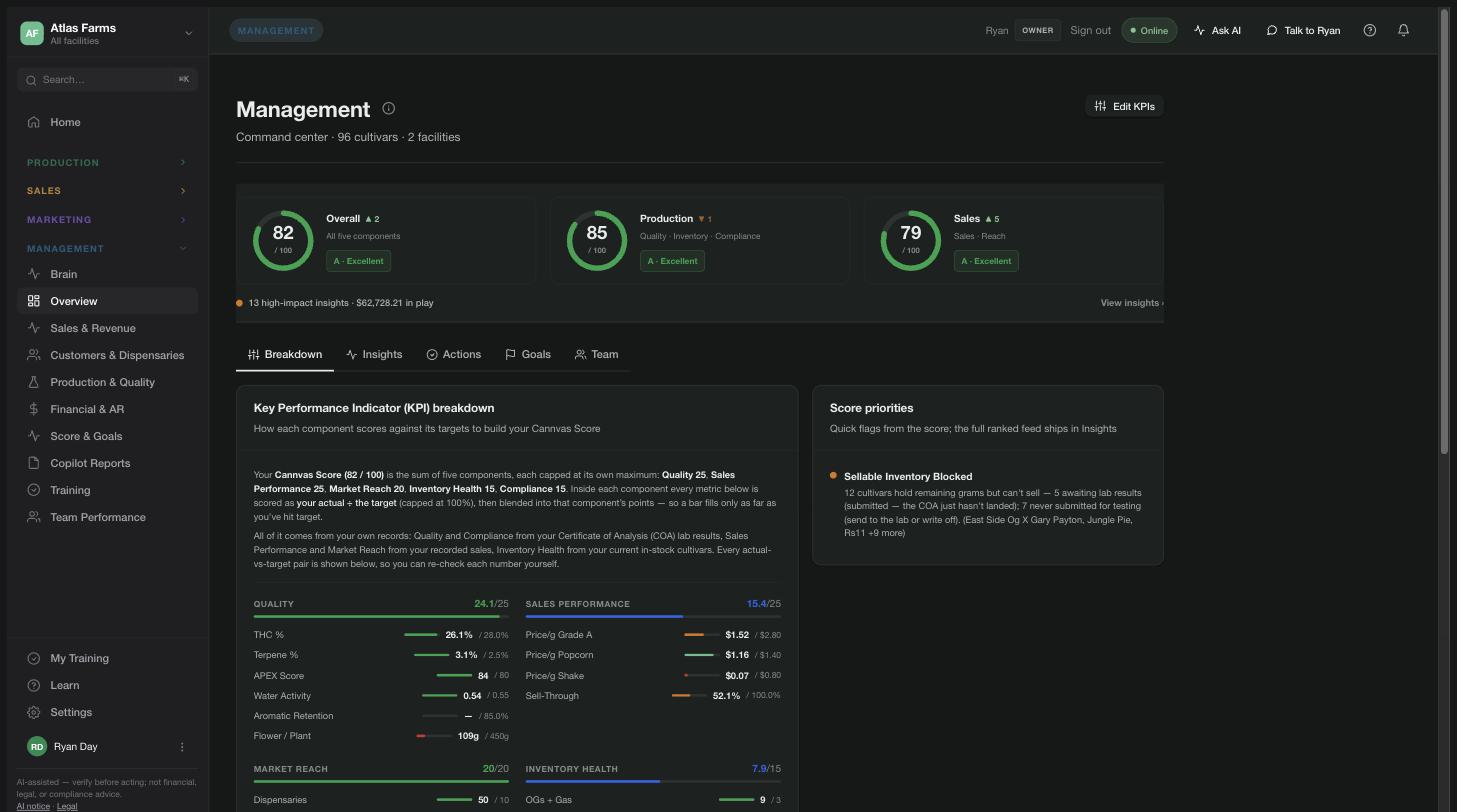
One screen: performance across all departments, the key performance indicators for each — and the year-end projection at today’s pace, next to the goal it has to reach.

The Management command center — Cannvas Score 82, Production 85, Sales 79, with the full KPI breakdown and score priorities

The spine of the feedback loop. The projection isn’t a report card — it’s the opening position for every decision this page makes possible.

2.0 The insights

Drill into anything. Find the hidden opportunities.

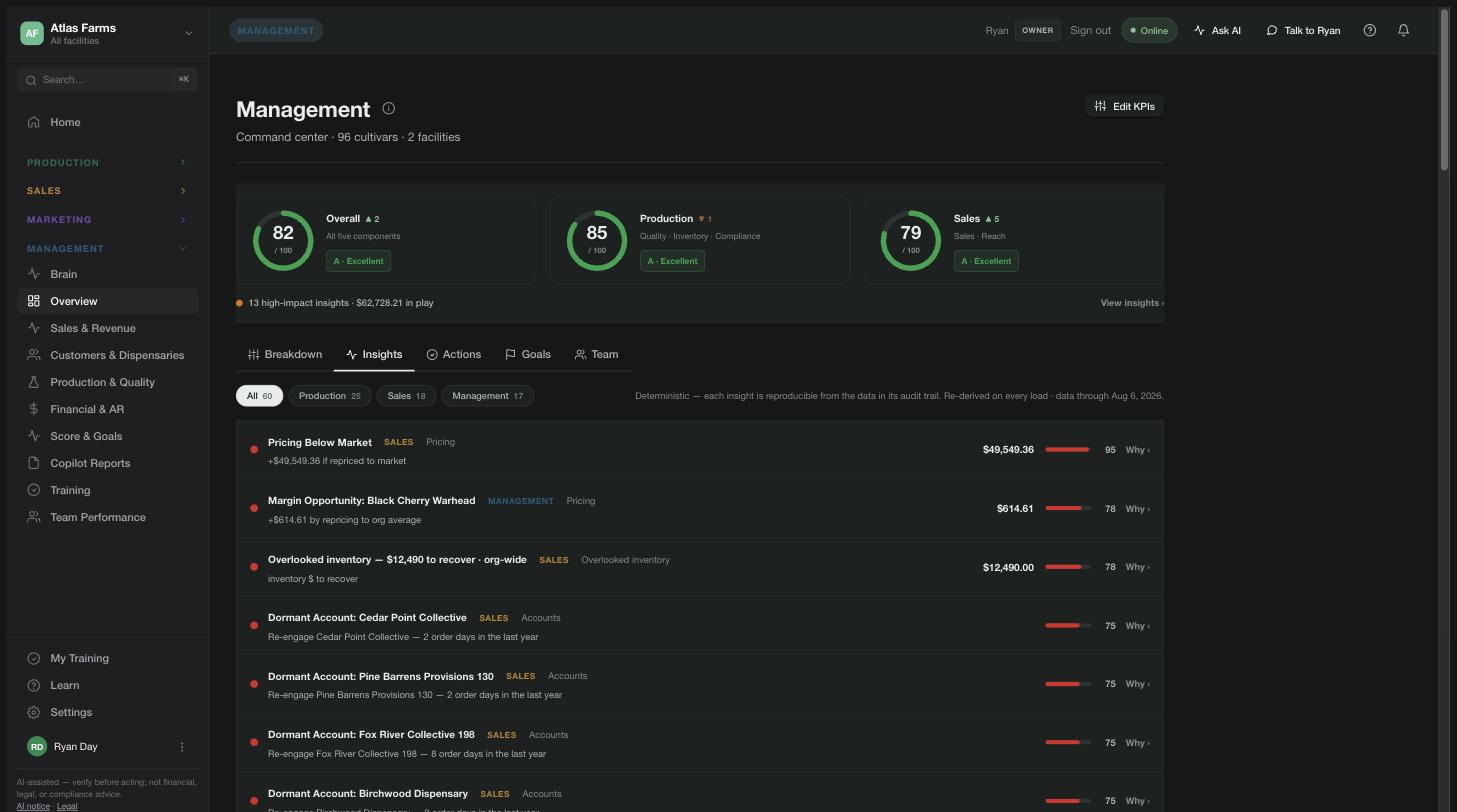
Every insight is deterministic — reproducible from the data in its audit trail, re-derived on every load. Ranked by dollar impact, so management sees where improvements can be made and where hidden opportunities lie.

The insights feed — 13 high-impact insights, $62,728 in play: pricing below market, margin opportunities, dormant accounts to re-engage

$62,728 in play, ranked. Pricing below market, margin opportunities on specific cultivars, dormant accounts worth re-engaging — each with the dollar figure attached.
3.0 The levers

This is where the interconnectedness comes in.

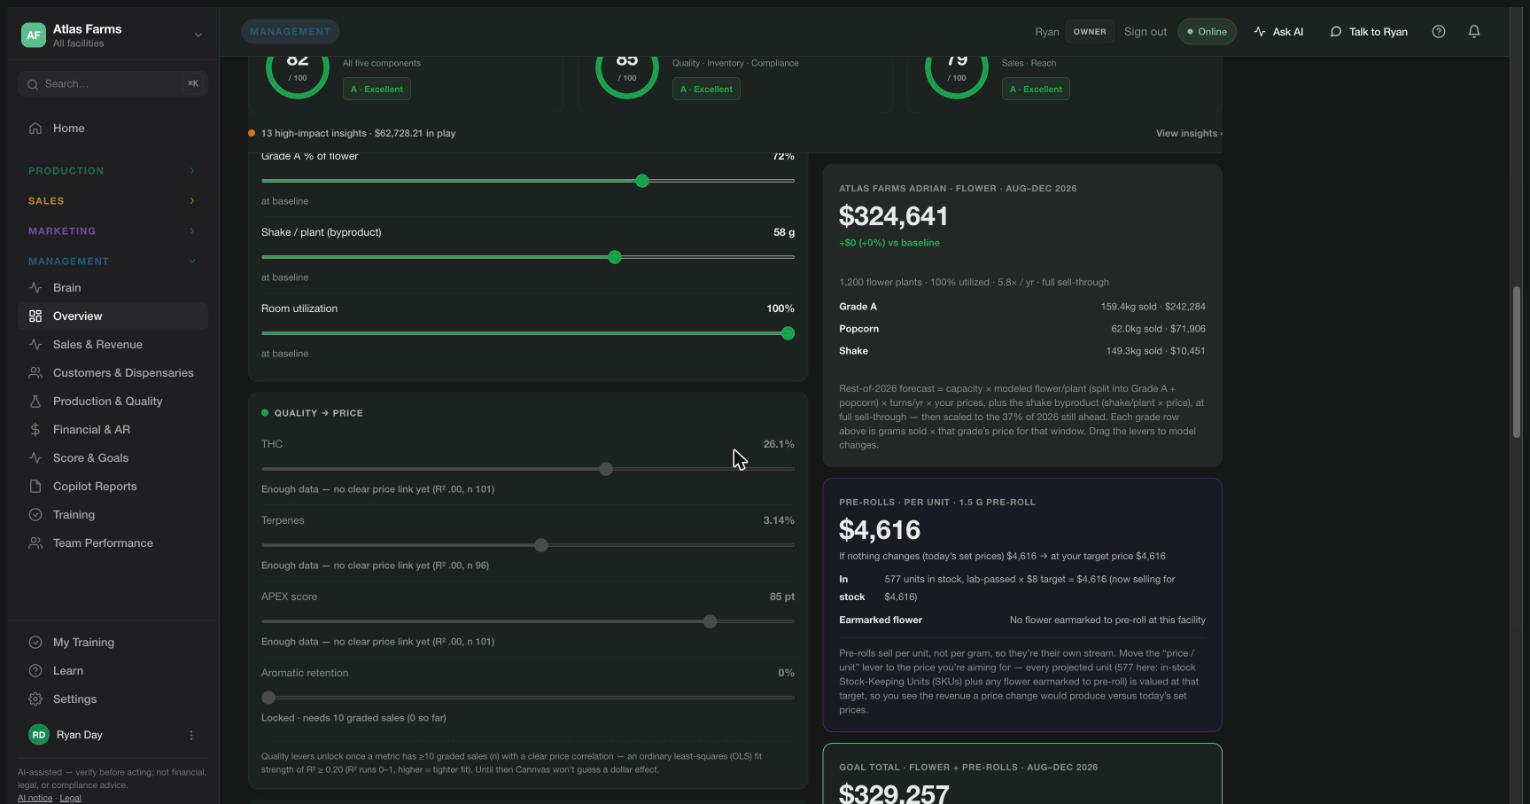
The real goal levers — Grade-A mix, shake per plant, room utilization, and the quality-to-price levers for THC, terpenes, and APEX, each moving the live revenue forecast

This is where the interconnectedness comes in: more flower per plant, a better grade mix, higher THC, terpenes, or APEX ratings — drag a lever and watch how it moves the needle on revenue. Quality levers unlock only when the data shows a real price correlation — until then Cannvas won’t guess a dollar effect.

4.0 Set the goal, push the targets

One goal becomes everyone’s targets.

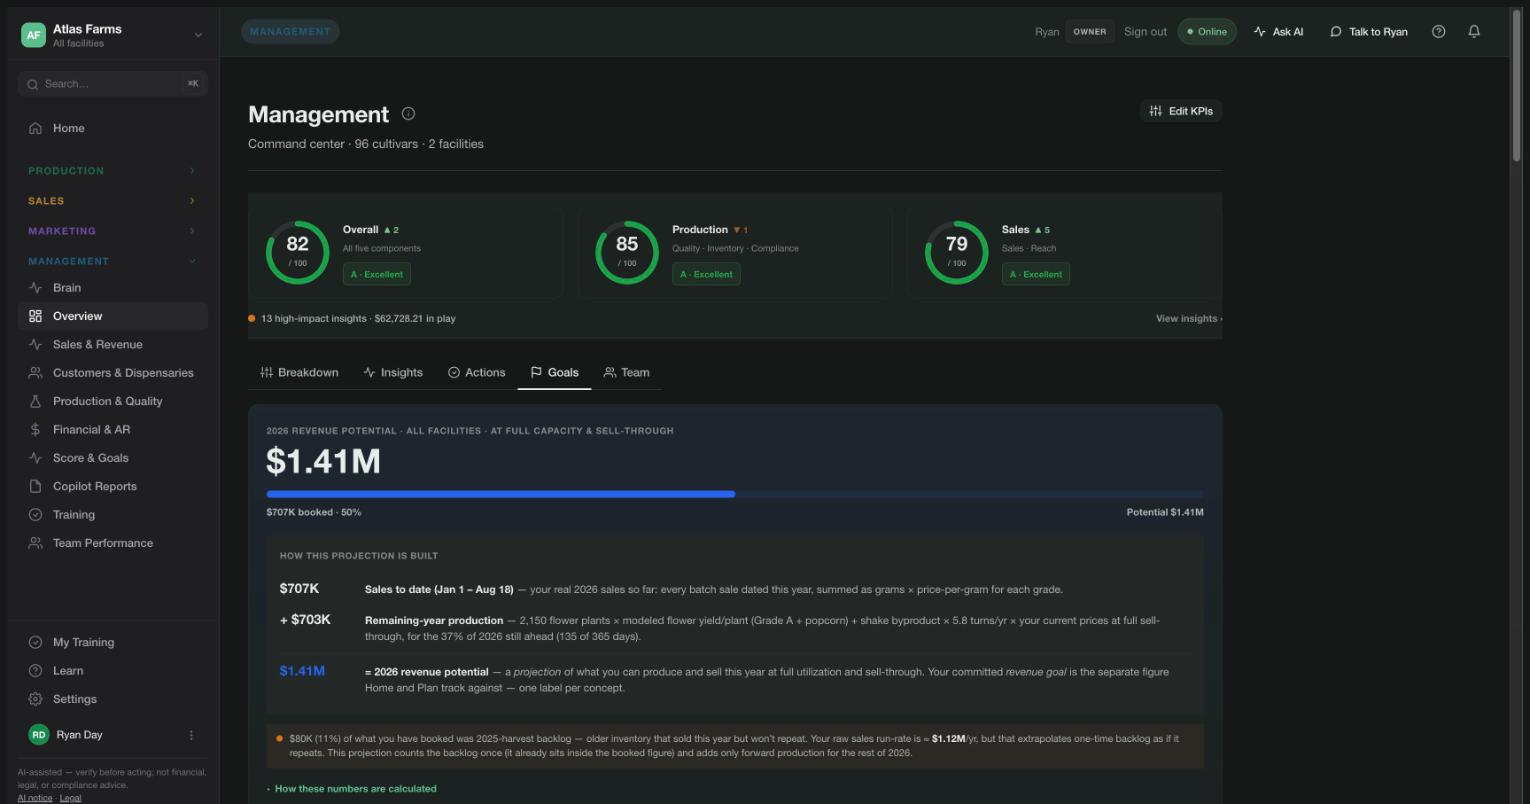
Management sets the revenue goal against what production can actually deliver. The goal splits into targets — and pushes to the production and sales managers as their new numbers. No meeting required.

Setting the 2026 goal — $1.41M revenue potential at full capacity and sell-through, with the projection built line by line from real sales and remaining-year production
Production managernow
New targets from management Flower/plant ≥132 g · Grade-A ≥78% · terps ≥3.5%
Sales managernow
New targets from management Grade-A ≥$1.60/g · sell-through ≤45d

Owners track progress from the same page — and every target traces back to the goal that set it.

5.0 Track the progress

Owners watch the goal move — and see what moved it.

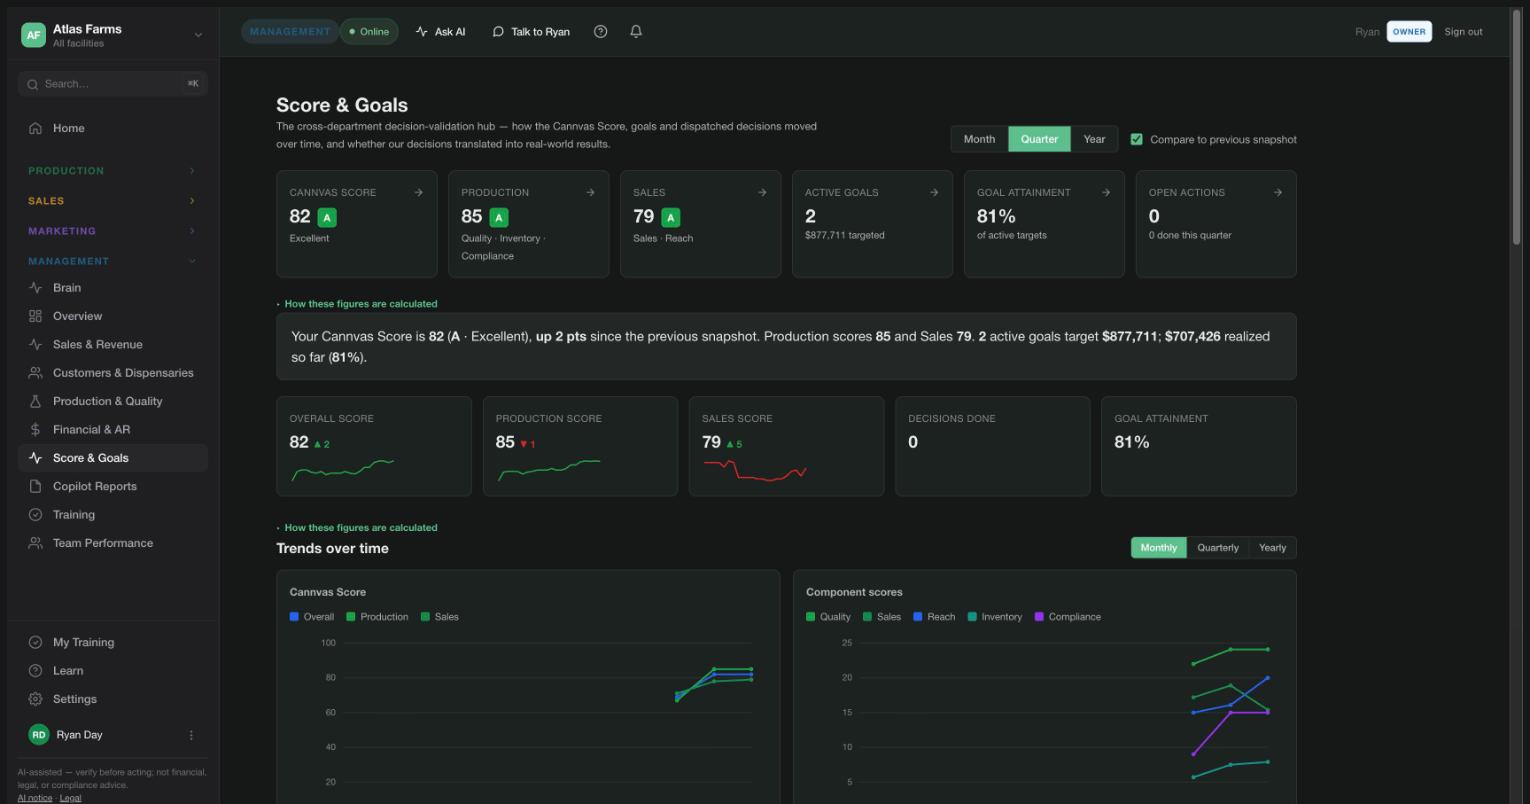
Score & Goals is the cross-department decision-validation hub: how the Cannvas Score, active goals, and dispatched decisions moved over time — and whether the decisions translated into real-world results.

Score and Goals — Cannvas Score 82 up 2 points, 2 active goals targeting $877,711, 81% attainment, with score and component trends over time
5.1 The verdict

Did what we planted deliver?

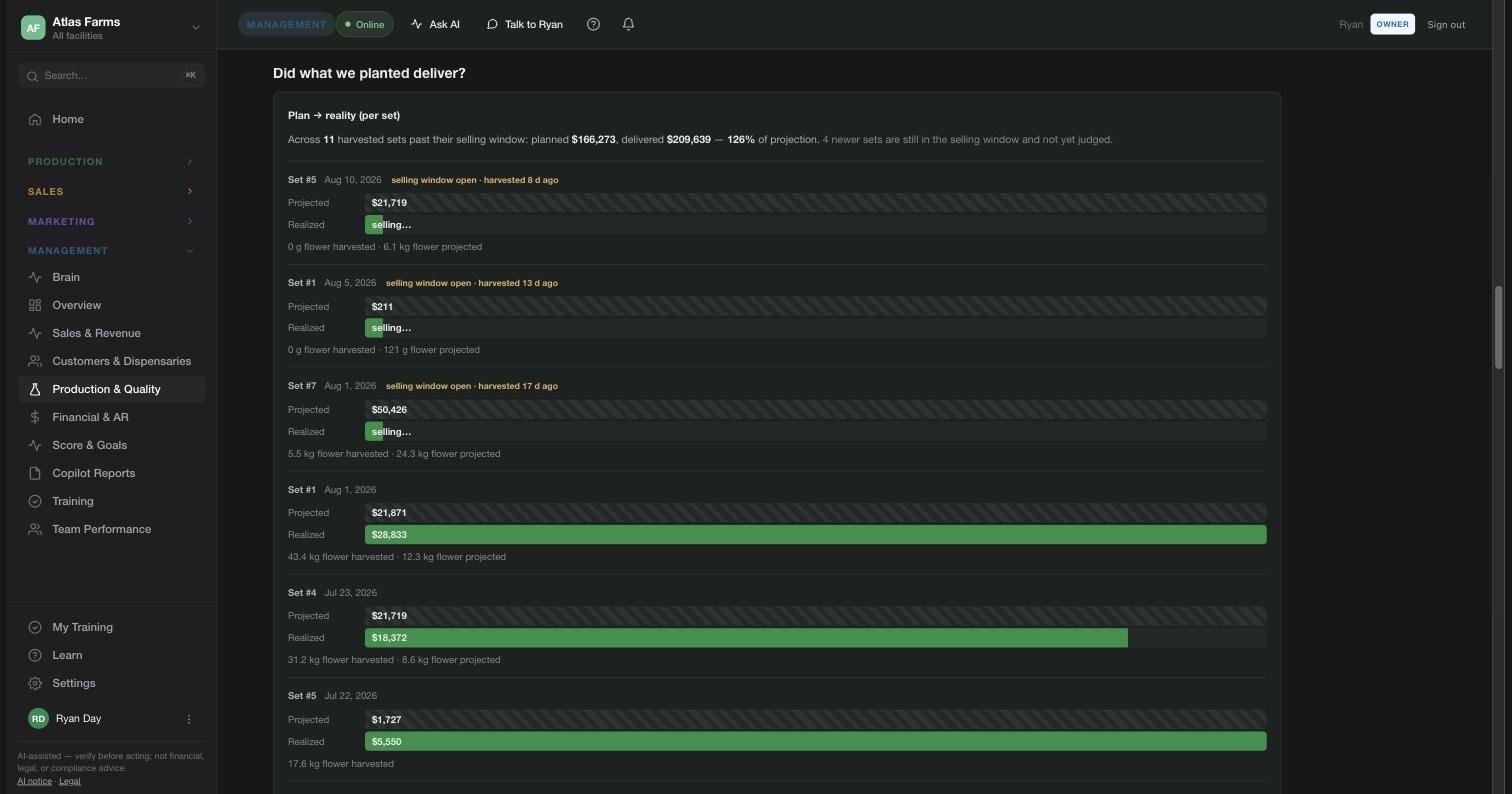
Every set carries the revenue it committed to when it was planned. When its selling window closes, the plan meets reality — projected against realized, set by set.

Did what we planted deliver — plan versus reality per set: across 11 harvested sets past their selling window, planned $166,273, delivered $209,639, 126% of projection, with per-set projected and realized bars and sets still in their selling window shown but not yet judged

Sets still inside their selling window are shown but never judged. A pure comparison, not a causal claim — the projection is the number committed at planning time, the realized bar is recorded sales of that set's cultivars, and neither is ever restated.

6.0 The four reports

Four reports. Every metric, lifetime vs current.

Production & Quality, Sales & Revenue, Customers & Dispensaries, Financial & AR — a true evaluation of how the business is performing. Every rate is shown against its lifetime baseline, so “better or worse” is never a guess.

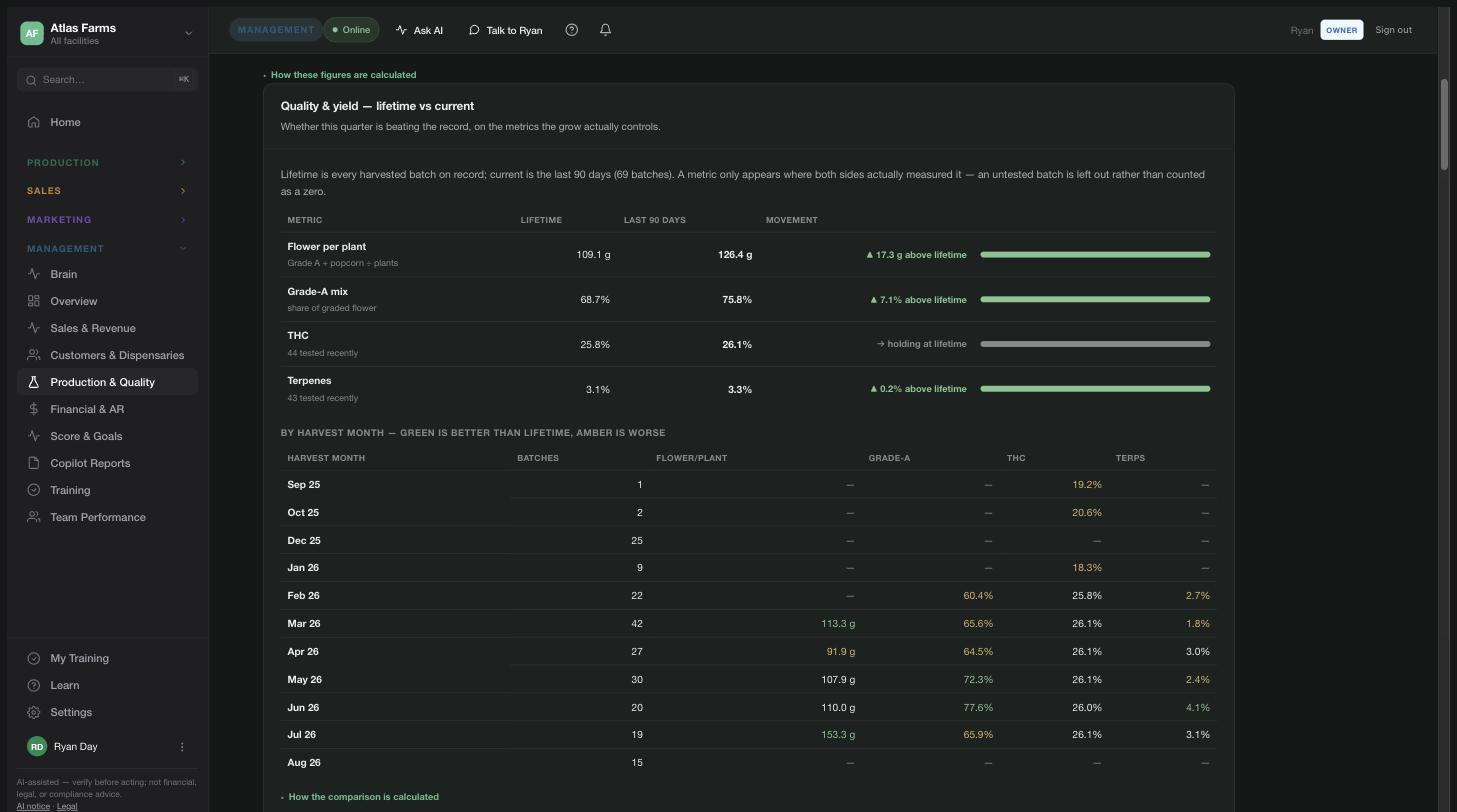
Production & Quality — every metric lifetime vs current: flower per plant 17.3g above lifetime, Grade-A mix 7.1% above, THC holding, terpenes above — and the harvest-month breakdown, green better than lifetime, amber worse
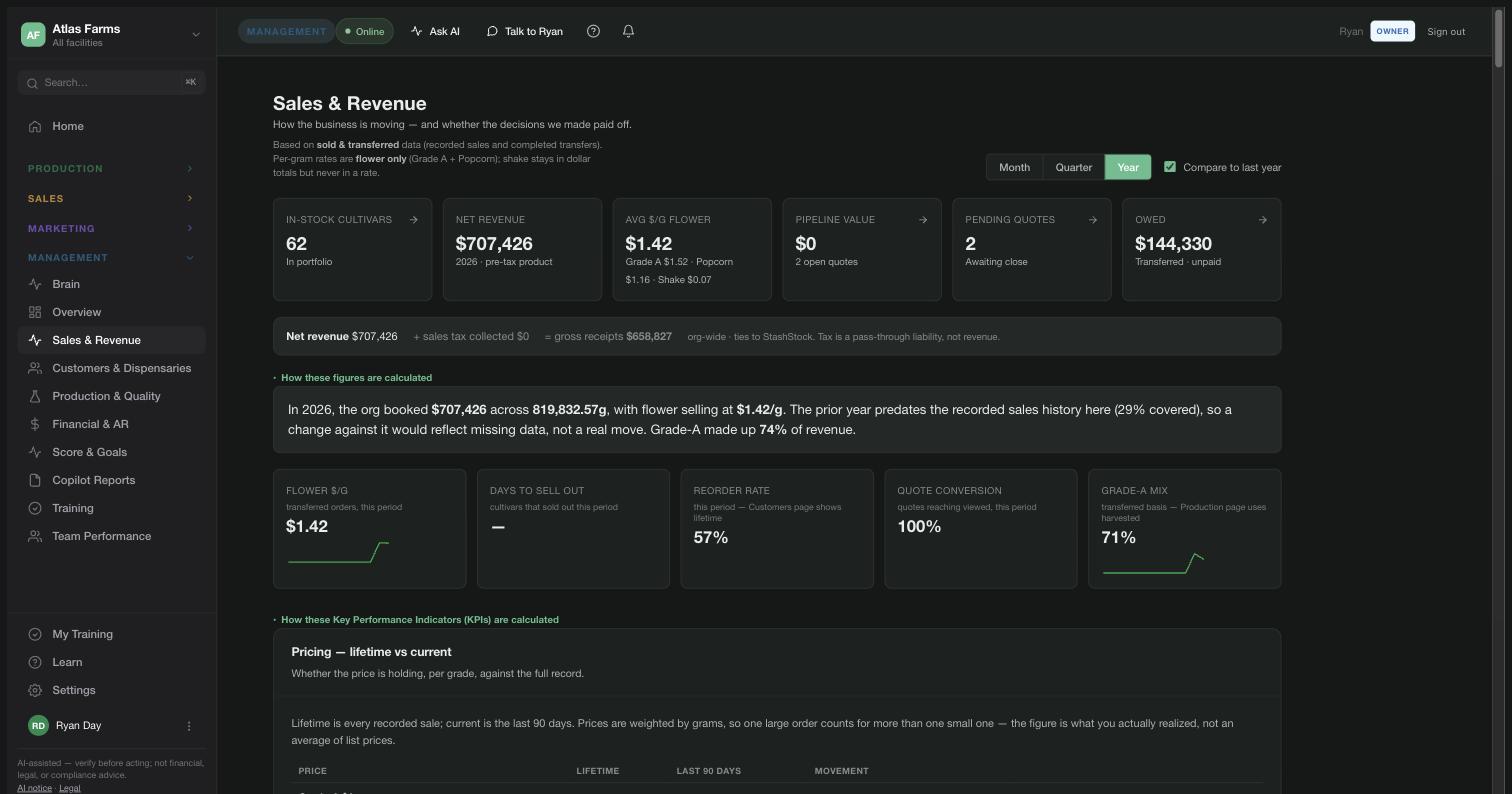
Sales & Revenue — $707,426 net revenue, $1.42/g flower, reorder rate 57%, quote conversion 100%, Grade-A mix 71%, $144,330 owed on transferred orders
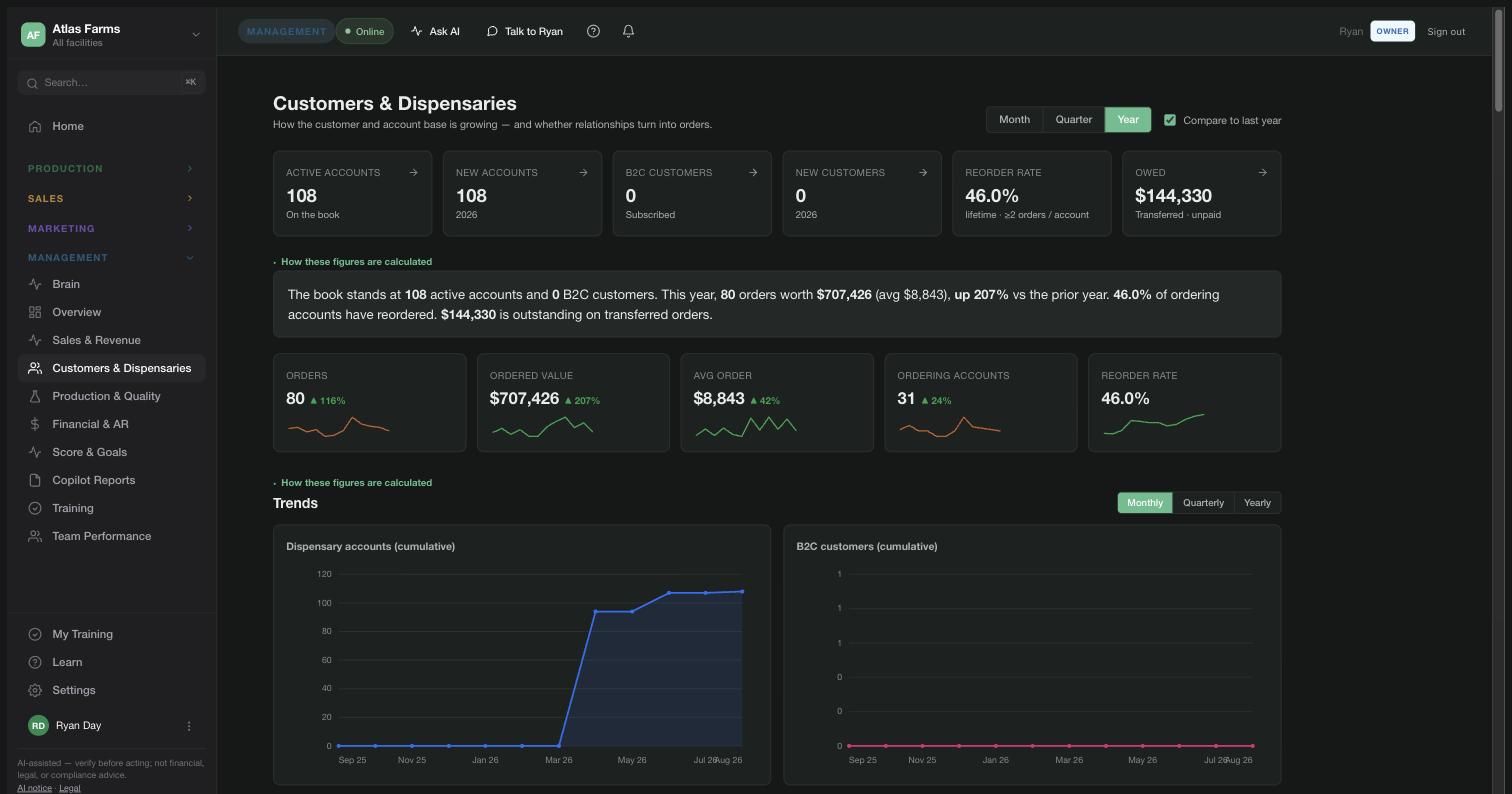
Customers & Dispensaries — 108 active accounts, 80 orders worth $707,426 this year up 207%, average order $8,843, 46% lifetime reorder rate, $144,330 outstanding on transferred orders
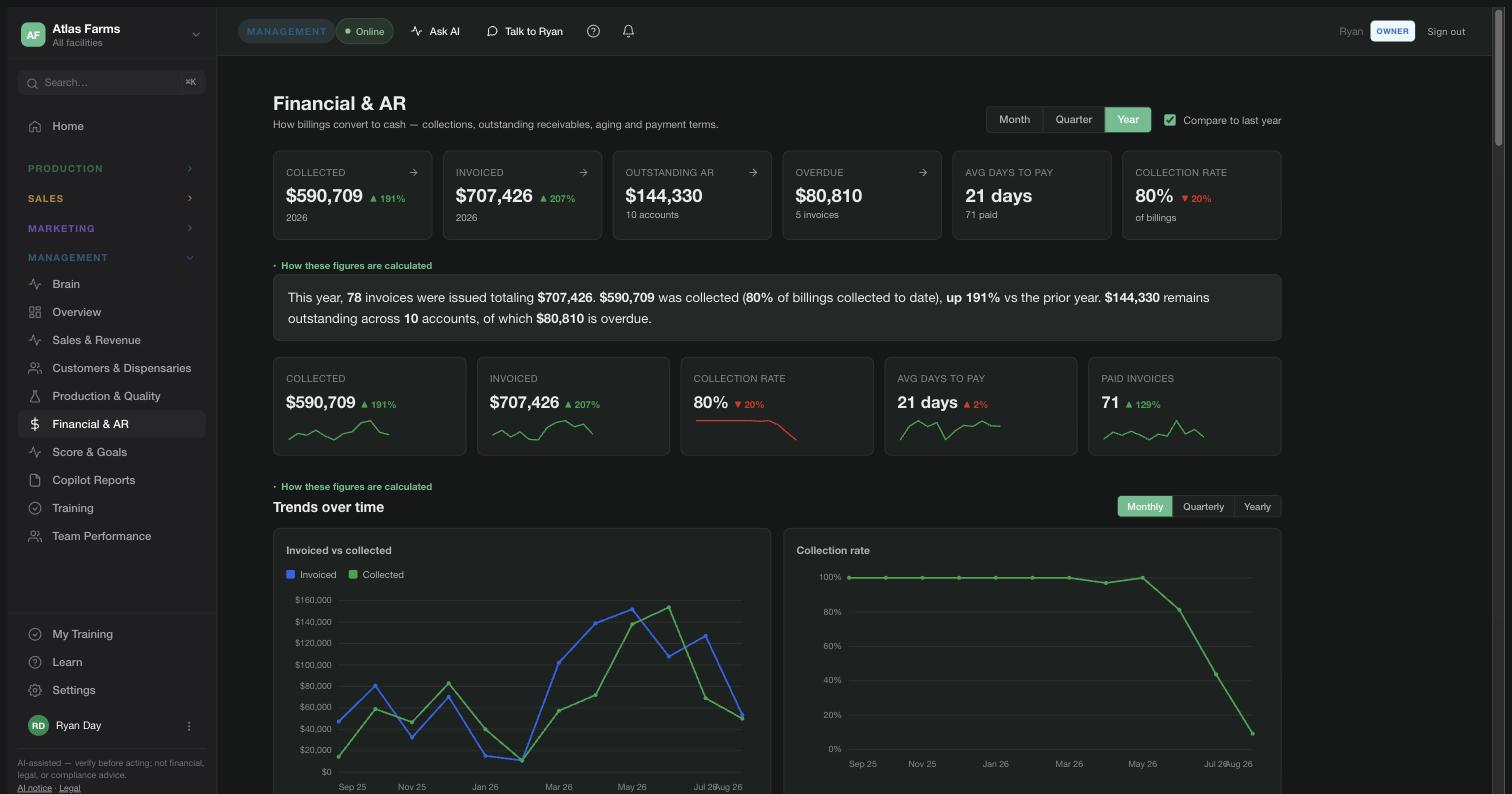
Financial & AR — $590,709 collected of $707,426 invoiced this year, 80% collection rate, $144,330 outstanding across 10 accounts, $80,810 overdue, 21 days average to pay, with invoiced-vs-collected and collection-rate trends
Progress toward the full-year goal · 62% · day 224 of 365

One canonical computation per metric. Every surface reconciles to the digit — the number on this page is the number on every page, and it is never fabricated from missing data.

6.1 The team

Performance, captured from the floor — not from a form.

As the crew works through the day’s tasks on the production floor, every sign-off carries its timestamp. Two lenses read it: each person against their own lifetime pace, and each job against its top performer — the fastest proven hands with clean sign-offs. Home leads with both: the people to recognize get the same billing as the trend that needs attention, and one tap sends recognition to the person’s phone and inbox.

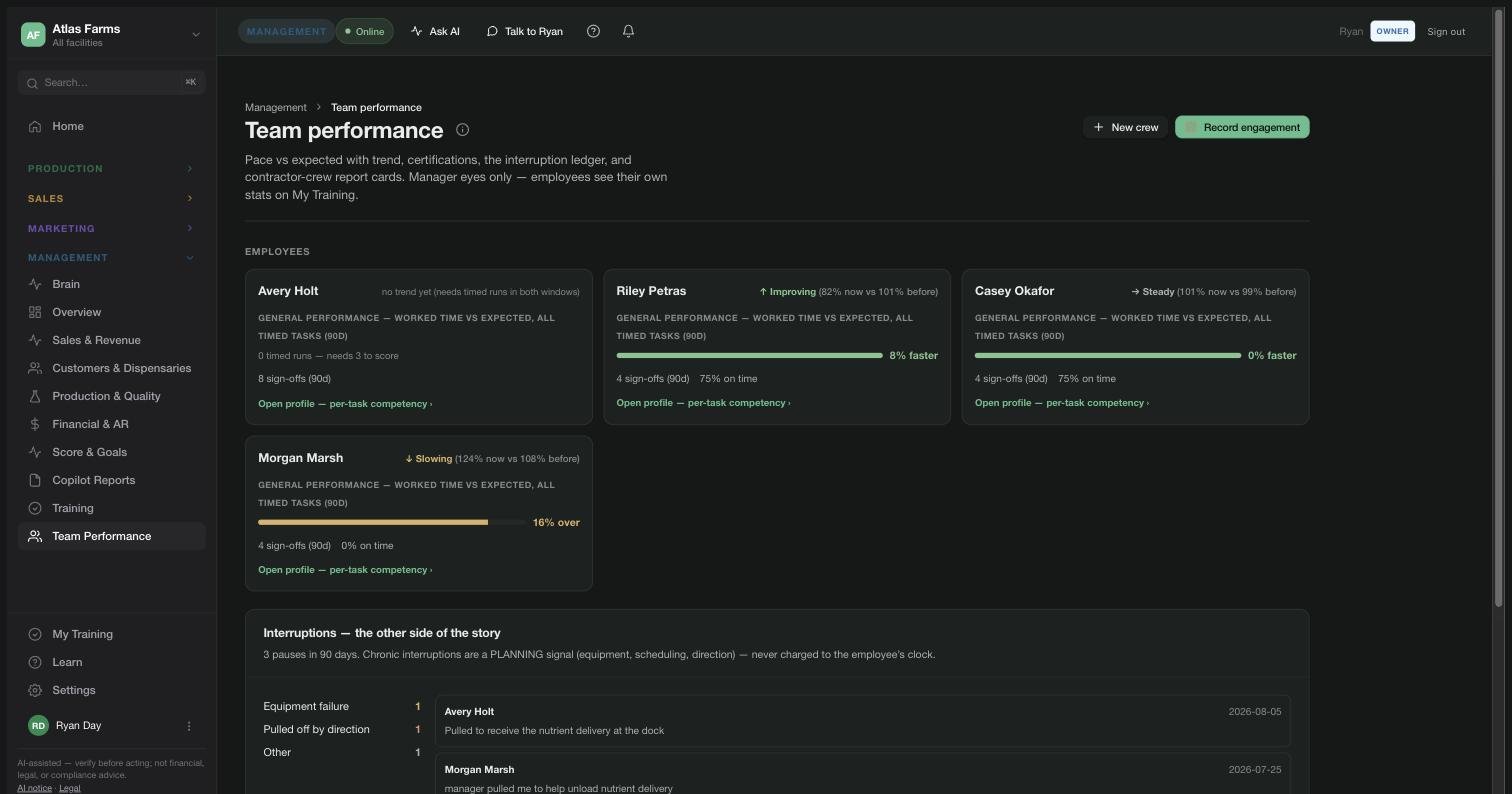
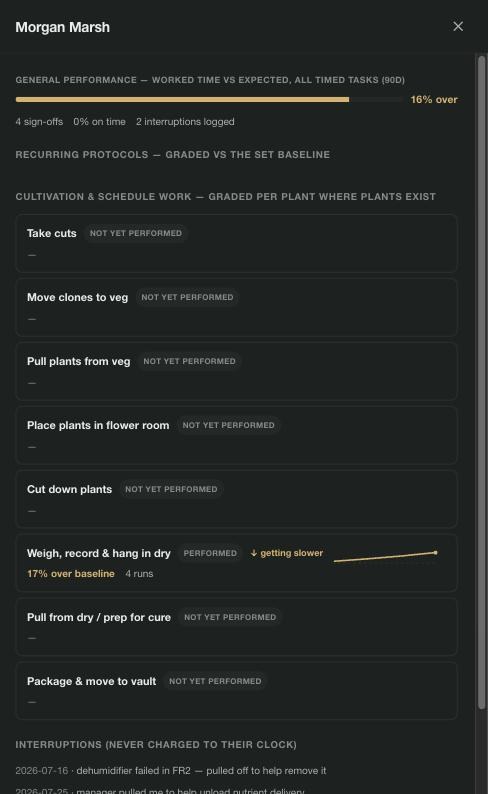
Team performance — pace versus expected with trend per employee: one improving 8% faster, one steady, one slowing 16% over, each with sign-off counts and on-time rates, above the interruption ledger
An employee's per-task competency profile catching a slide early — 16% over expected with 0% on time, weigh-record-and-hang performed but getting slower at 17% over baseline across 4 runs, the remaining task universe not yet performed, and the interruption ledger showing a dehumidifier failure pull that was never charged to their clock

Open a profile and every task is graded against that person’s own baseline — here, a slide caught early: one task drifting 17% over, flagged “getting slower” before it costs a harvest. The same numbers feed the assignment picker, so each day’s tasks route to the people most proficient at them — operational efficiency by default, coaching where it’s needed. Interruptions stay the other side of the story: logged, categorized, never charged to the employee’s clock. Manager eyes only; every employee sees their own stats on My Training.

6.2 Performance rewards

Set the metric. Cannvas measures it, records who earned it, you approve.

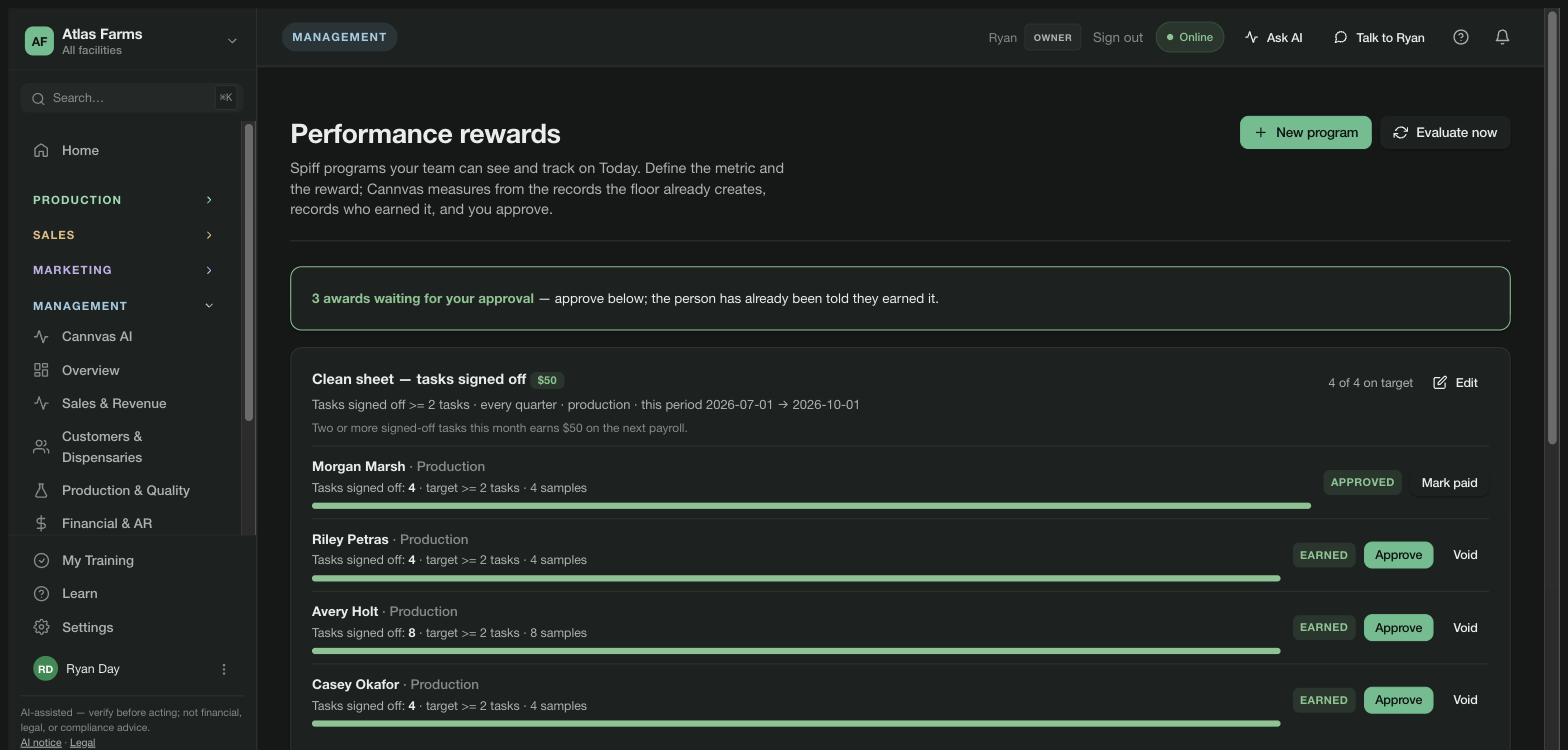
Turnover is high and good work goes unthanked. Each org defines its own SPIF programs from ten deterministic metrics — tasks signed off, on-time rate, deviation-free rate, pace against the benchmark, training modules, and more — with a target, a period and a reward. Staff watch their own progress on Today, with what’s still needed; the moment a target is crossed the award is recorded, the person and the managers are told, and the owner approves and marks it paid. Cannvas records the award; payroll moves the money.

Performance rewards — 3 awards waiting for approval; the Clean sheet program, tasks signed off at least 2 per quarter for production, $50: four growers with their counts, progress bars and Approve, Mark paid or Void
7.0 Cannvas AI

The living map that tracks everything — and answers anything.

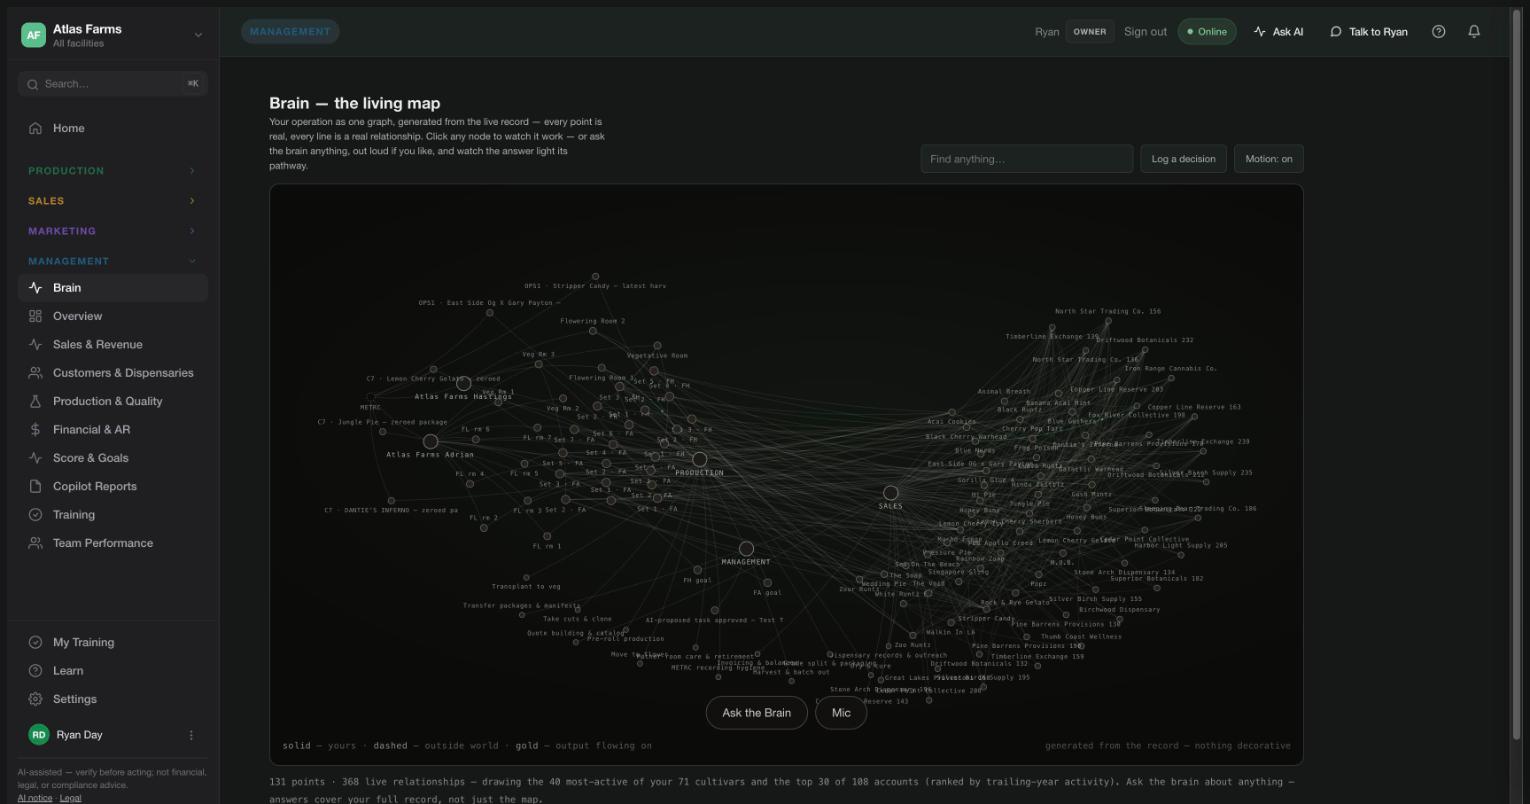
Cannvas AI — the operation as one graph: 131 points, 368 live relationships across cultivars, rooms, sets, accounts, and goals, generated from the live record. Nothing decorative

Every point is real, every line a real relationship — 131 points, 368 live relationships, generated from the record. One name, everywhere: the drawer on every page and this workspace are the same Cannvas AI. Ask it anything, out loud if you like, and the answer lights its pathway through the map.

7.1 The brief

The brief first. An action on every line.

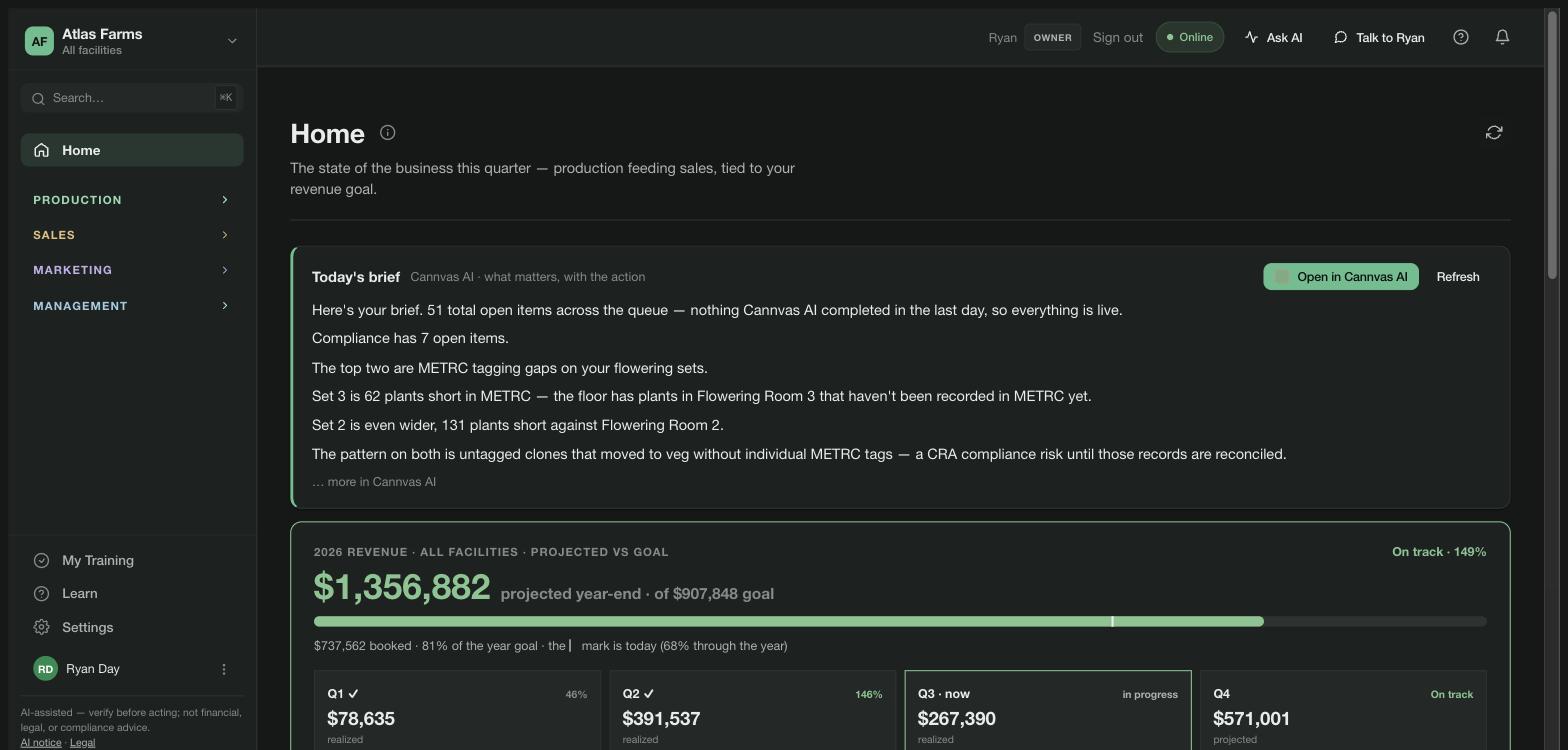
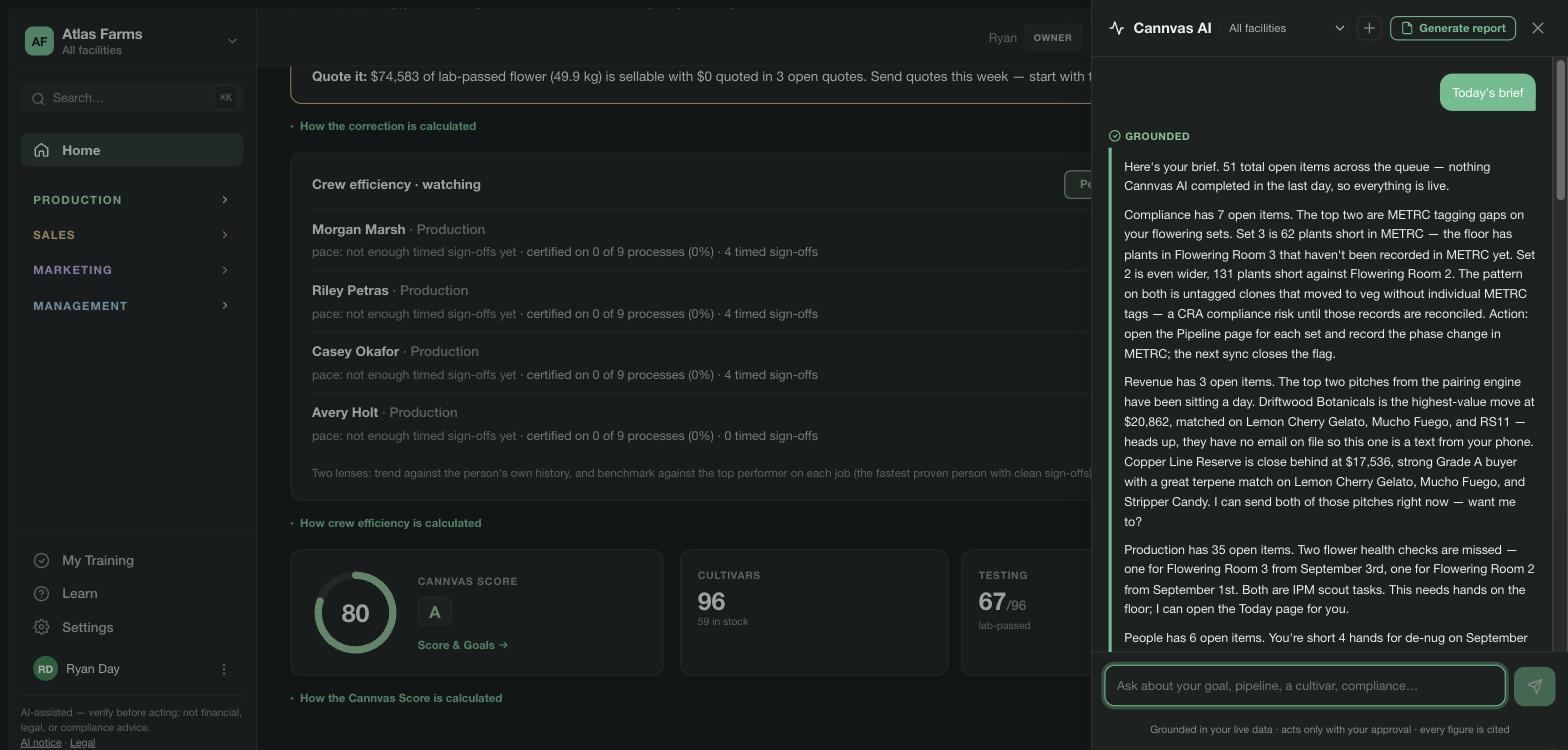
Nobody has time to dig through the data. Home opens with today’s brief — three to five plain-English items in priority order, each with the why and the one thing to do — drawn from a queue Cannvas AI rebuilds after every sync. Compliance, revenue, production, people and data are separate lanes, never ranked against each other; the brief shows the top of every lane that needs looking at and asks which to take first. Items close when the system sees them done — the next sync, the sign-off — not when someone says so.

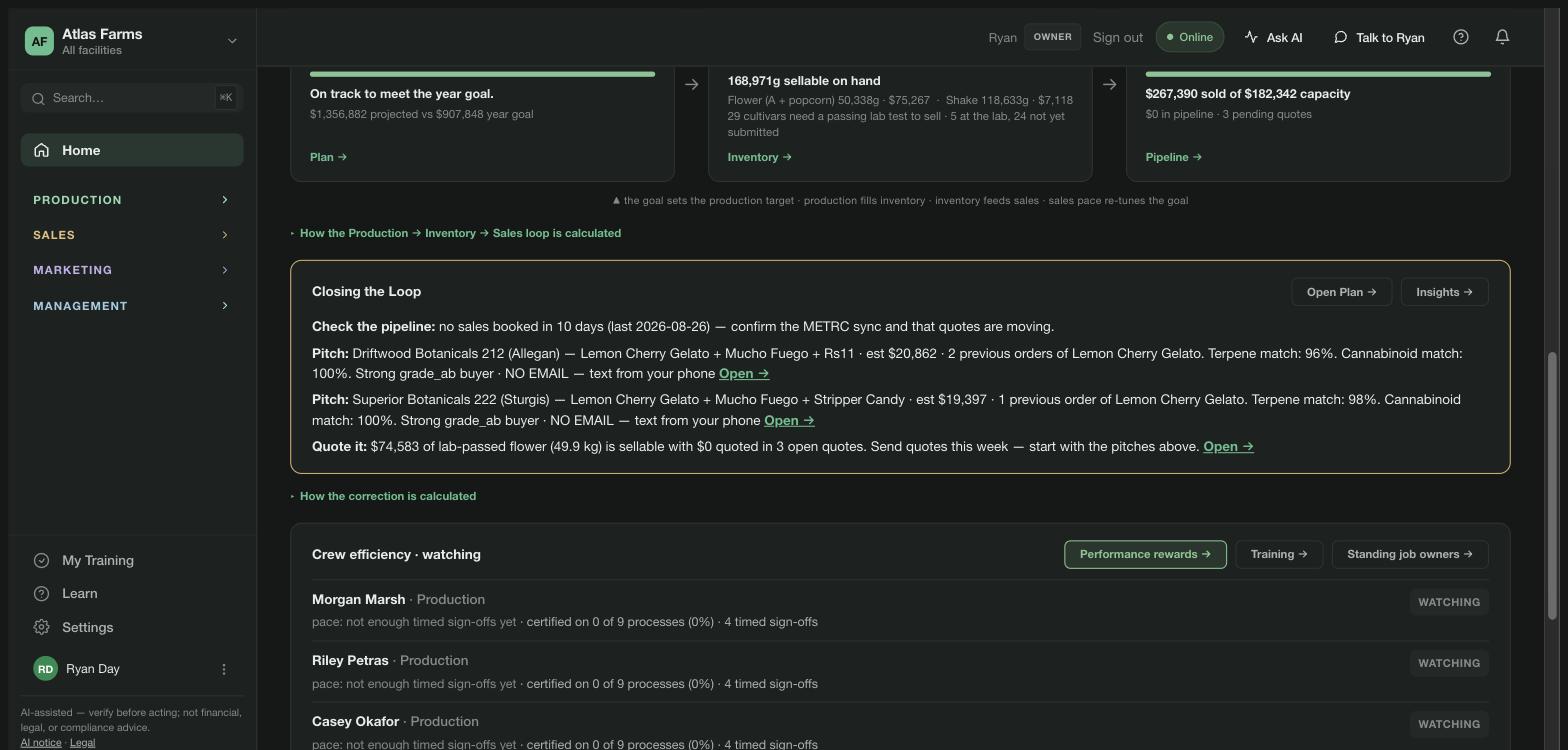
Home — Today's brief by Cannvas AI: 51 open items across the queue, compliance has 7, the top two are METRC tagging gaps on flowering sets, with Open in Cannvas AI; the 2026 revenue card beneath, on track at 149%
Closing the Loop on Home — check the pipeline; two pitches with the store, the cultivars, the estimated value, terpene and cannabinoid match and a text-from-your-phone link; Quote it: $74,583 of lab-passed flower sellable with $0 quoted
The Cannvas AI drawer answering 'Today's brief' — grounded: compliance, revenue, production and people lanes in plain English, each with its action, ending 'I can send both of those pitches right now — want me to?'
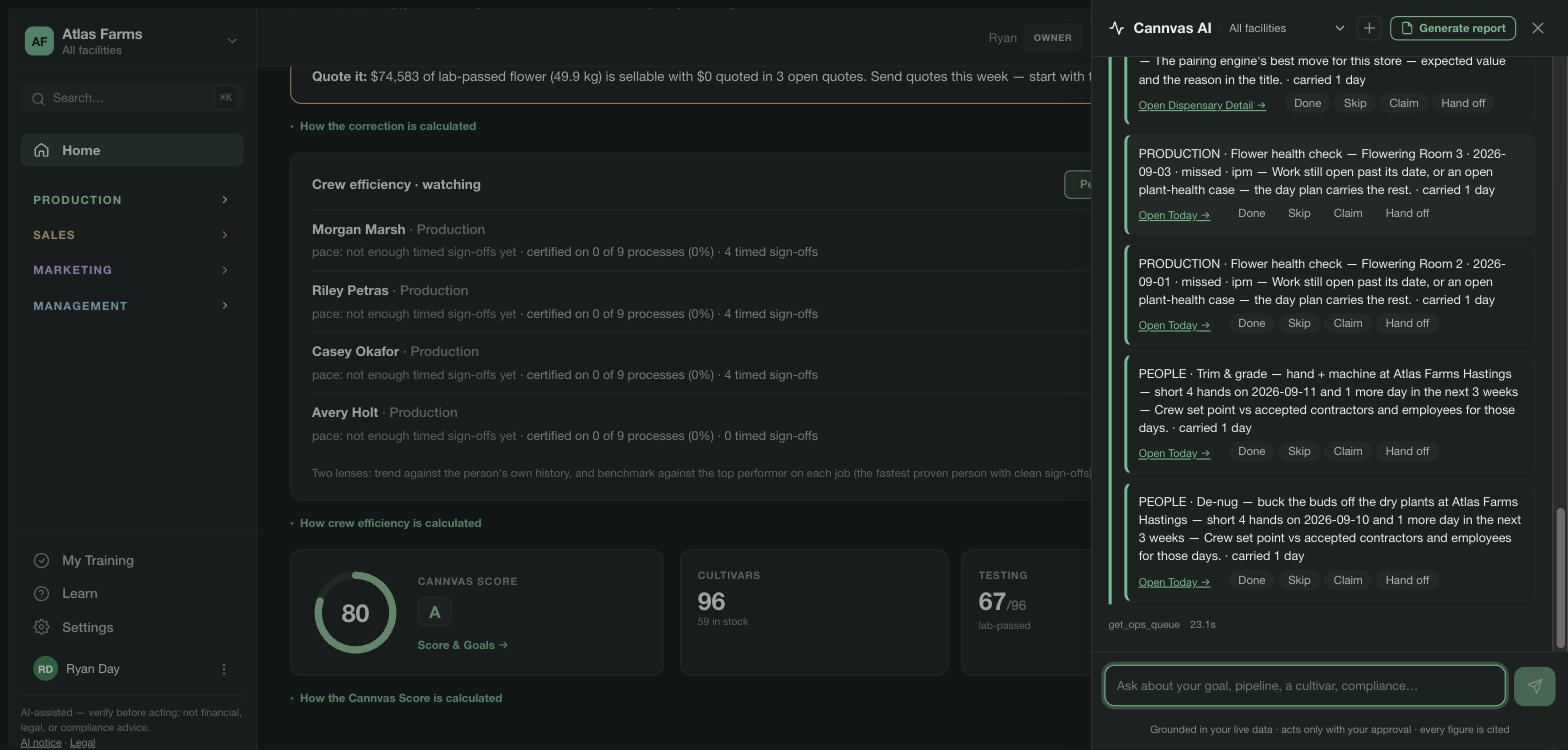
The ops queue in the drawer — production and people items with evidence, carried one day, each with Open Today, Done, Skip, Claim and Hand off
7.2 AI reports

Ask a question. Get an executive report.

Ask Cannvas AI anything, press Generate report — the grounded conversation becomes a shareable executive report, pushed to management for review. Every figure is engine-computed and cited; print it, hand it off, or follow its links back into Cannvas.

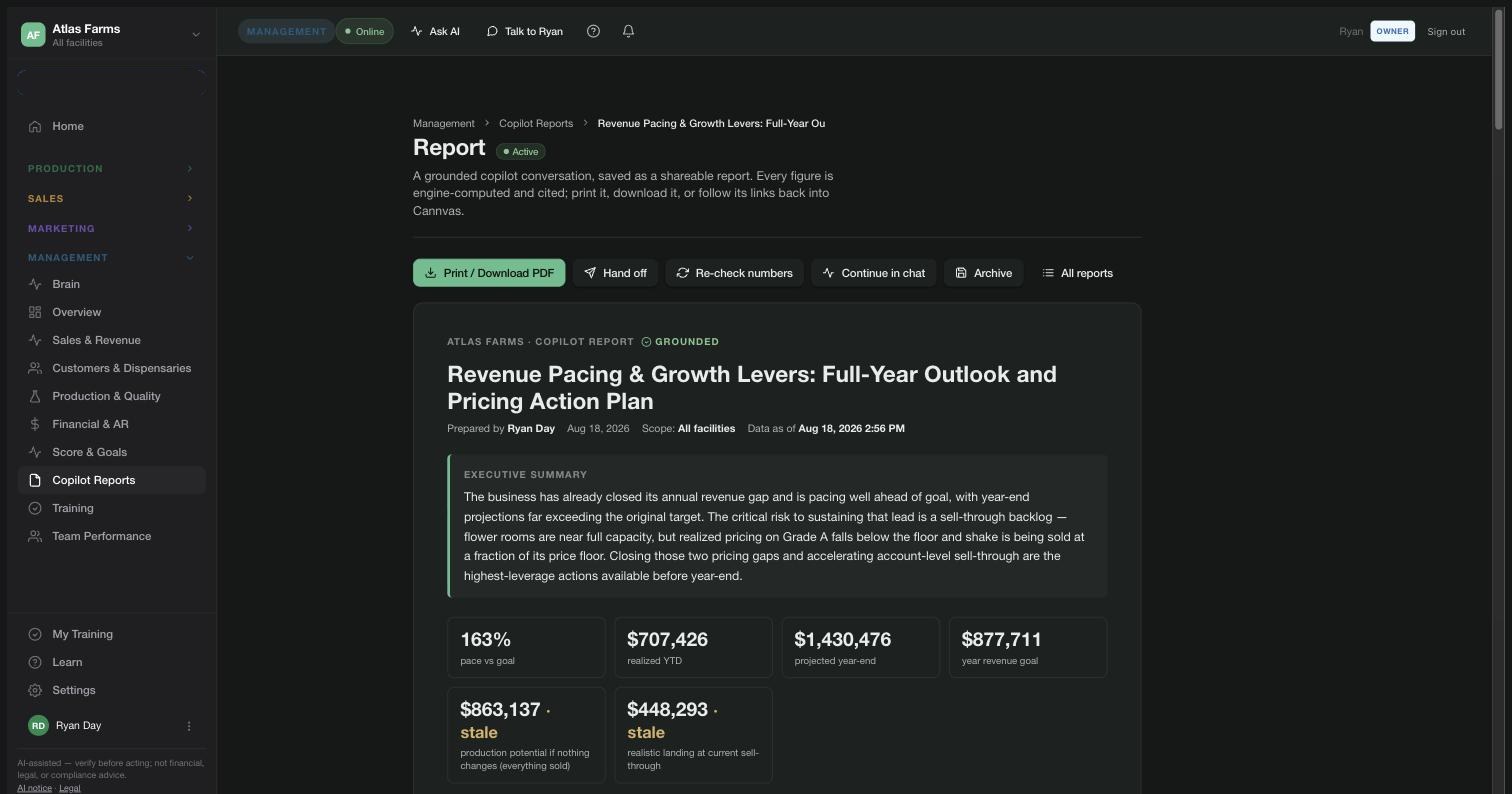
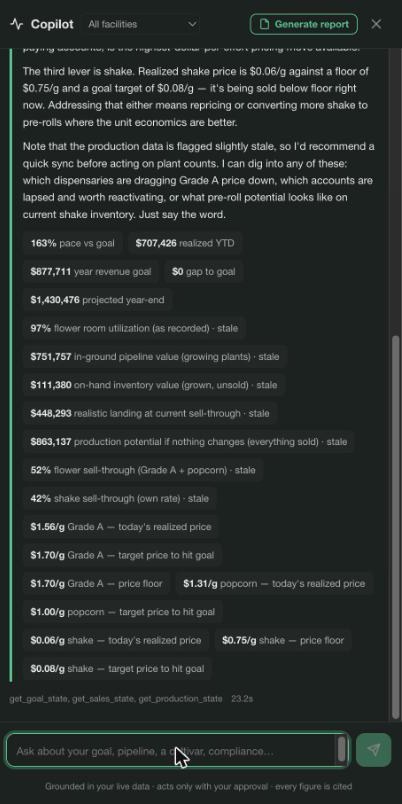
A generated Cannvas AI report — Revenue Pacing & Growth Levers: executive summary, 163% pace vs goal, $707,426 realized, every figure grounded and cited
Cannvas AI answering with citations — pace vs goal, realized YTD, projections, price floors and targets, each figure a chip that traces to its source

This report was generated by Cannvas AI, from the question “How are we pacing to the revenue goal, and which levers would close the gap fastest?” — exactly as you see it.

7.3 The work, done

“I can do that for you — want me to?”

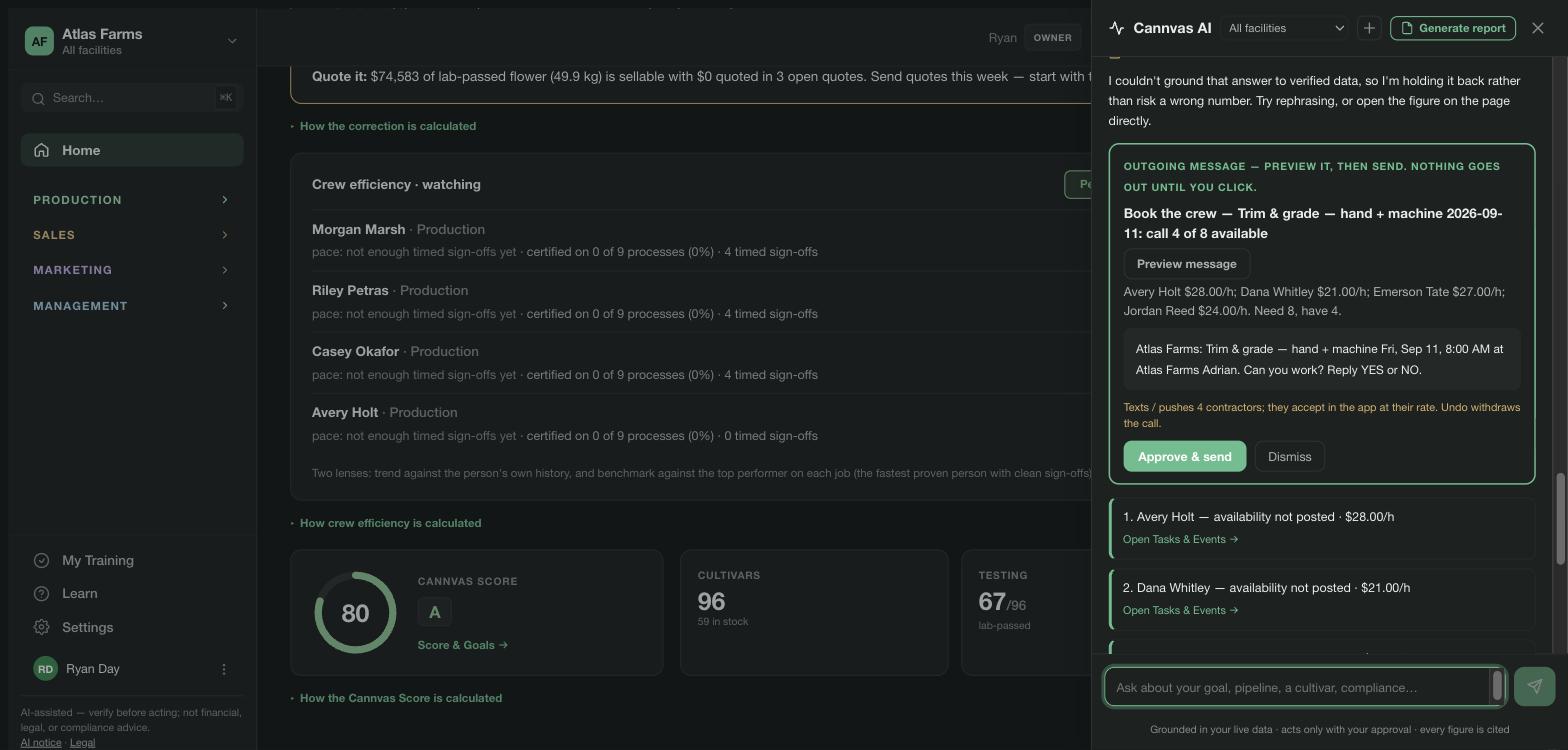
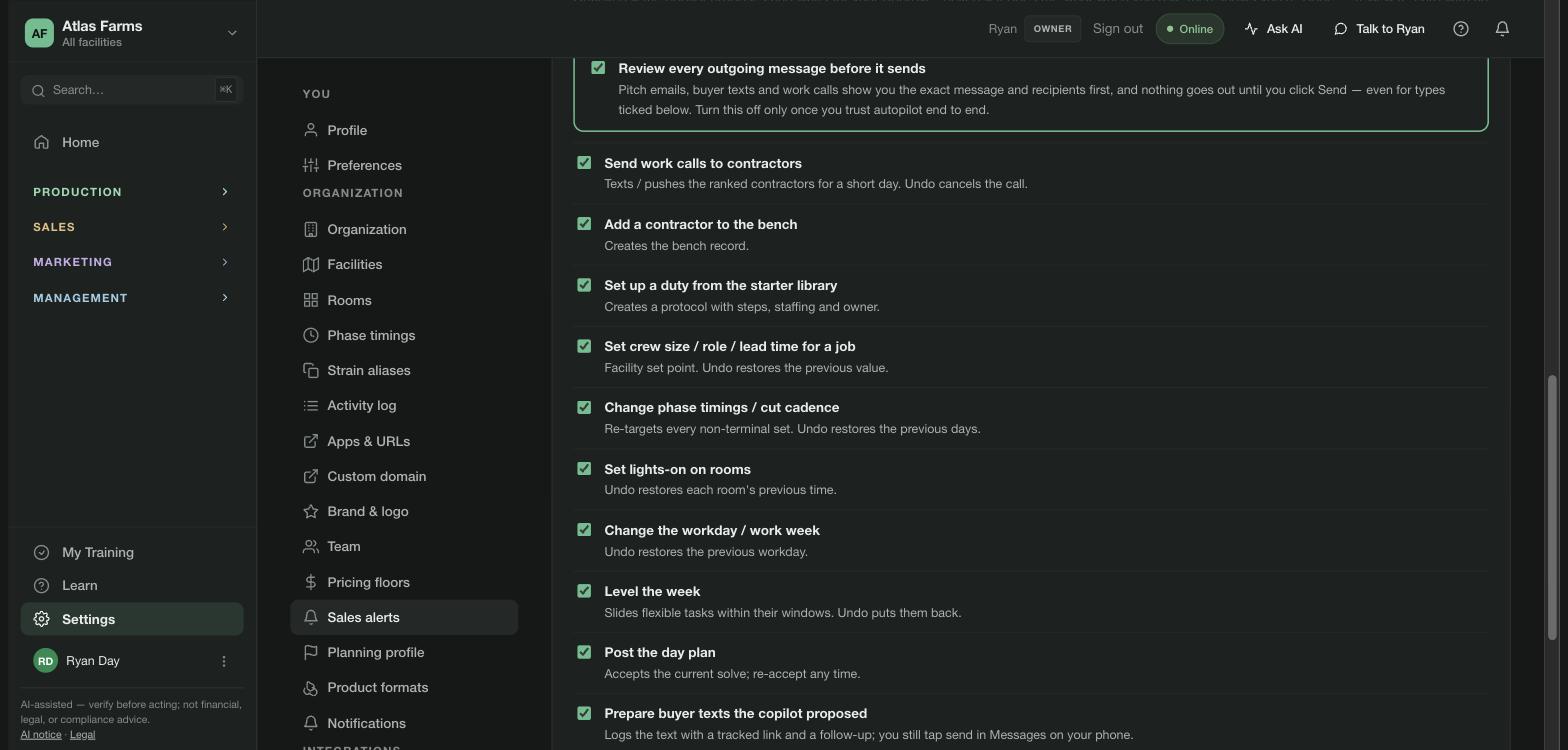
Ask how, and Cannvas AI explains the steps — then offers to do them. Say yes and it proposes the exact action: what it will change, who it will reach, the message it will send. Approve, and the step runs through the product’s own route — the same permission gate, validation and audit trail as your own click — and comes back as a receipt with Undo. Owners grant autopilot one action type at a time; granted steps finish overnight and wait for review in the morning. Work calls, contractor bench, protocols from the library, set points, phase timings, lights-on, the work week, leveling, the day plan, pre-roll sweeps, buyer texts.

Cannvas AI proposal — Outgoing message, preview it, then send: Book the crew, Trim & grade, September 11, call 4 of 8 available; the text previewed with the contractors and rates; Approve & send or Dismiss
Settings, Cannvas AI — Autopilot: review every outgoing message before it sends; send work calls, add a contractor, set up a duty, set crew size, change phase timings, set lights-on, change the workday, level the week, post the day plan, prepare buyer texts — each with what Undo restores
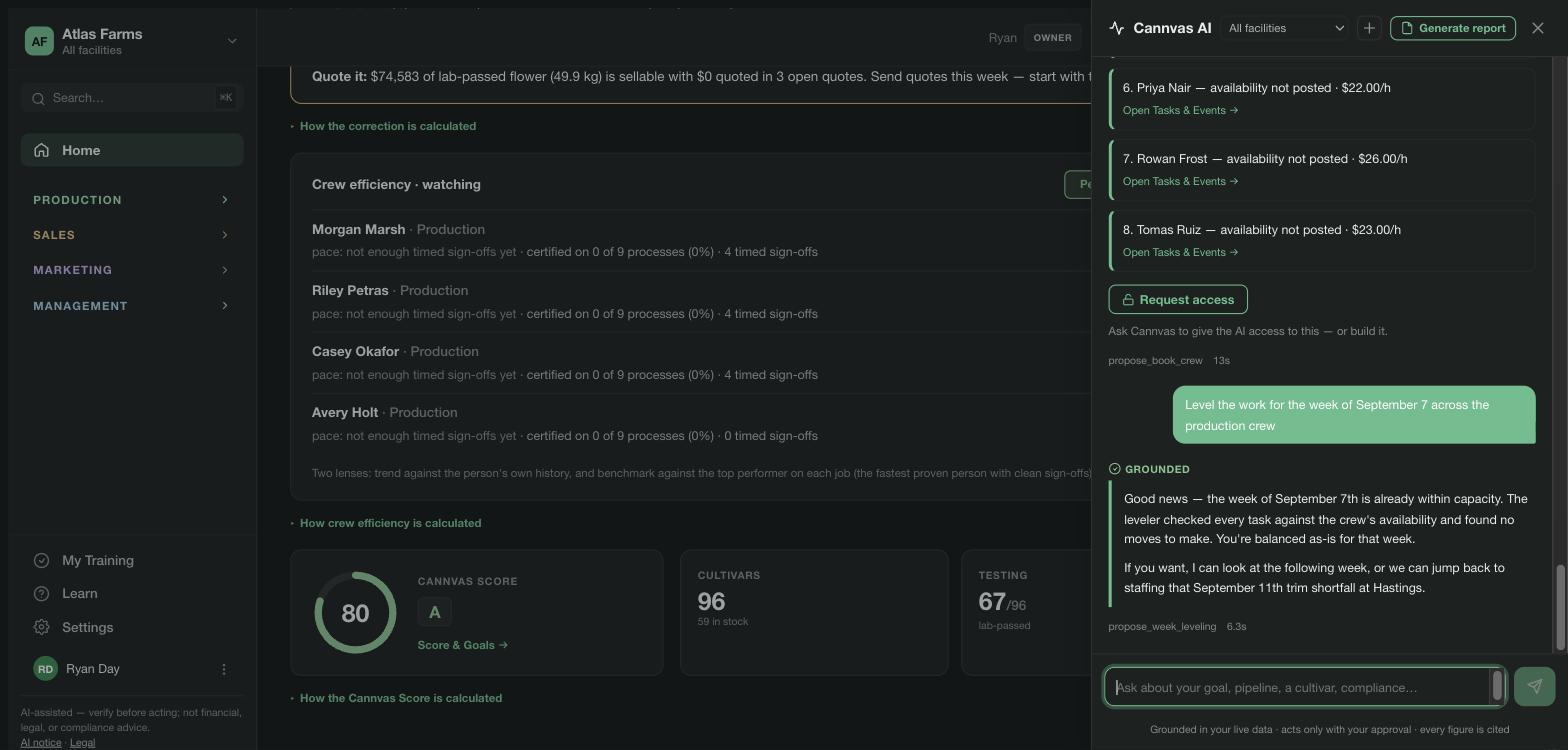
Cannvas AI asked to level the week of September 7 — grounded: the week is already within capacity, the leveler checked every task against the crew's availability and found no moves to make
7.4 The grounding contract

Answers grounded in data, never fabricated.

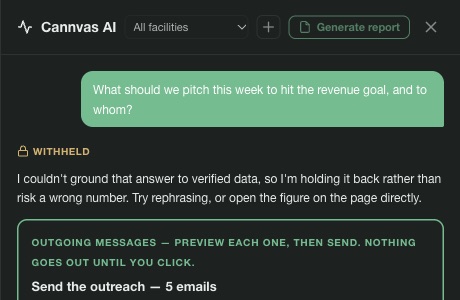
AI insights are only as good as the data behind them. Left unbound, AI hallucinates — offering plausible answers that sound correct but simply aren’t. Cannvas AI is bound to strict guardrails: it can only interpret real data, never fabricate.

Run the whole operation on truth.

One canonical computation per metric · every surface reconciled to the digit · goals, targets, and answers extrapolated from your org’s real data — continuously.

30-minute demo · or the full system on your data, free for 14 days.